Working with Charts
Overview
There are several different types of charts in the application, including pie, bar, time series, wind barb, and scatter.
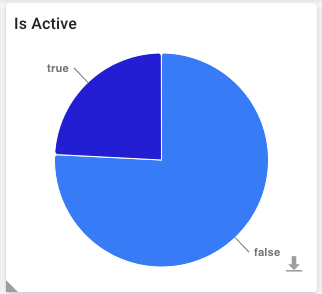
Figure: Above image shows the 'Is Active' pie chart on 'Stations' page.
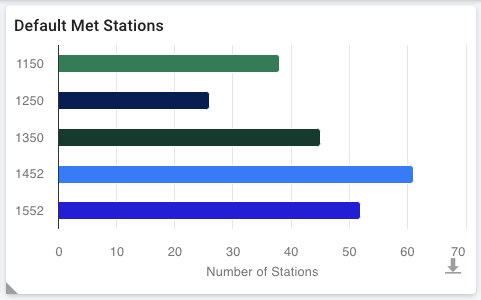
Figure: Above image shows the 'Default Met Stations' bar chart on 'Stations' page.
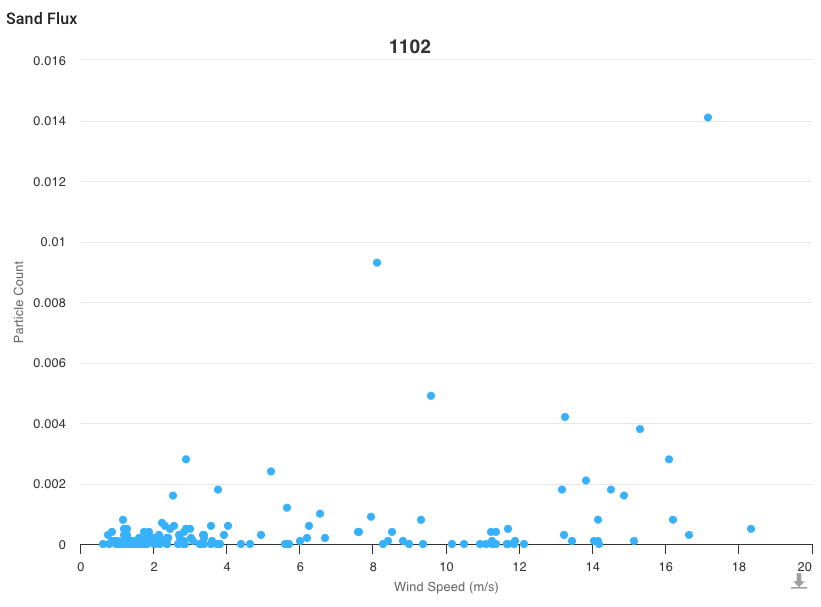
Figure: Above image shows a scatter plot chart on 'Sand Flux' page.
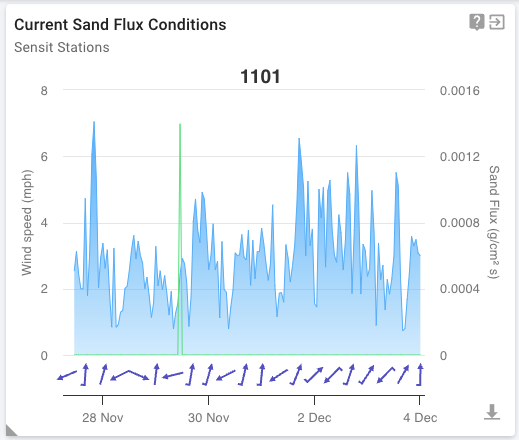
Figure: Above image shows the 'Current Sand Flux Conditions' wind barb chart on 'Compliance Dashboard' page.
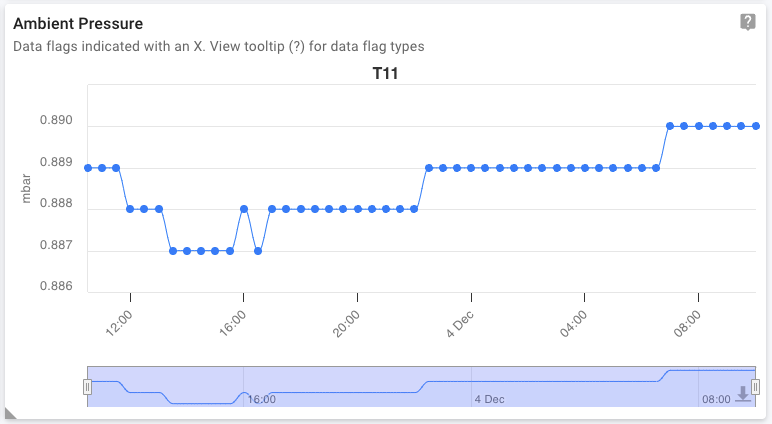
Figure: Above image shows the 'Ambient Pressure' time series chart on 'TEOM' page.
Chart features:
- Download
- Tooltips
Cross Filtering
Charts support cross filtering other components. Cross filtering allows users to interact with a chart to better understand how one metric affects another. Addtionally, cross filters can be used to limit the number of records being displayed.
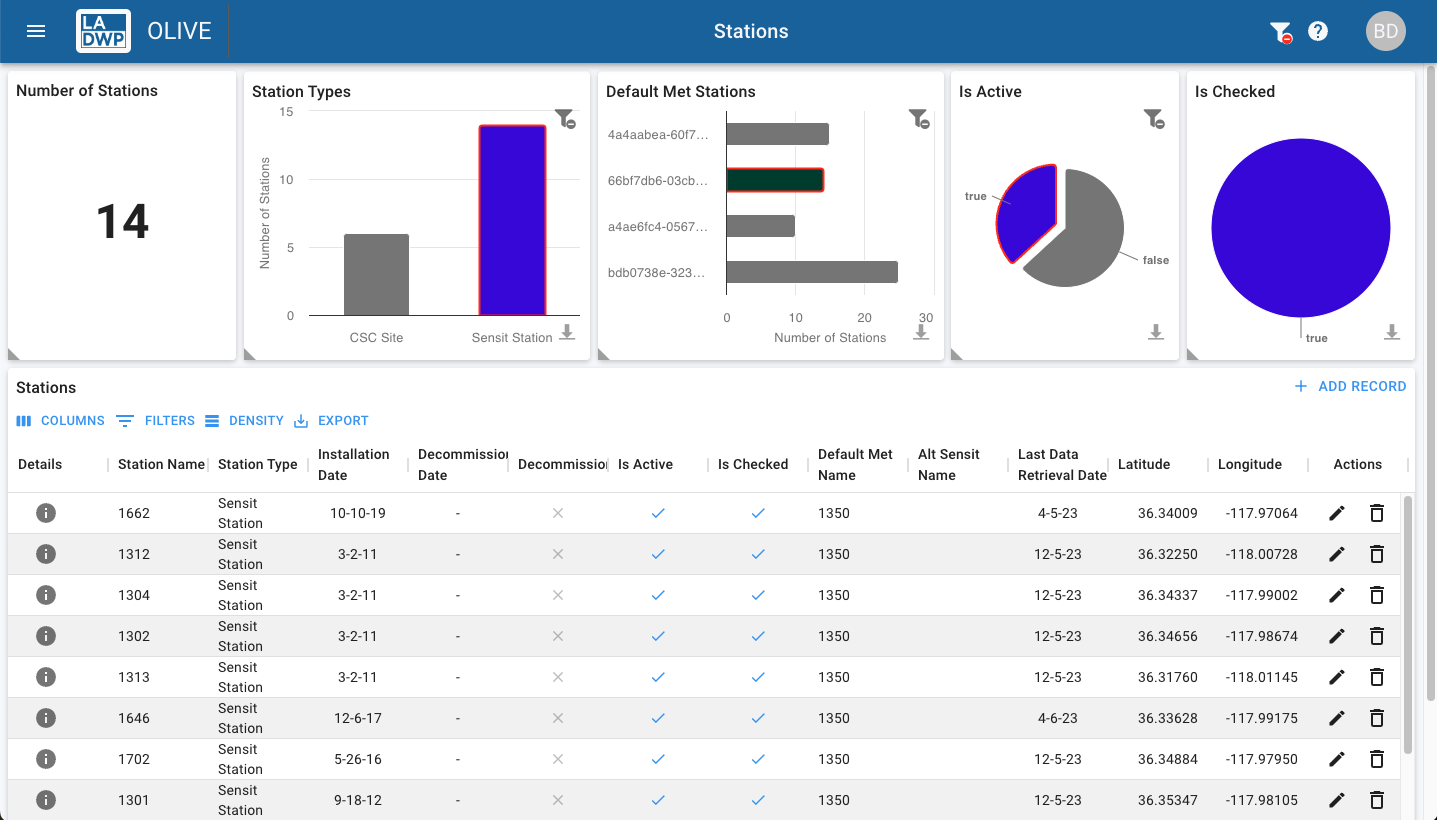
Figure: Above image shows the 'Stations' page where three cross filters are applied to only show active sensit stations where the default met station is 1350. This effectively, narrowed down the total number of stations from 524 to 14.
Download
Charts support downloading images and data. Filters are honored when downloading chart images and data. To show all data, clear any applied filters.
The Clear Filter button  is visible is a chart has a filter applied.
The Download button  is displayed in the bottom right corner of the chart. Selecting the button will open the download dialog.
The following download options are available: - Download PNG image - Download JPEG image - Download PDF document - Download CSV
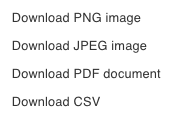
Figure: Above image shows the download dialog.
Tooltips
Charts support tooltips for series data. To view tooltips, hover over a series in the chart.
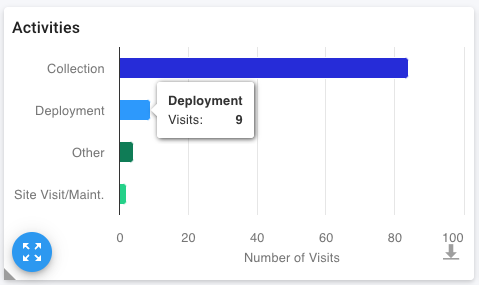
Figure: Above image shows a tooltip on the 'Activities' bar chart on the 'Field Data > Sensit Site Visits (tab)' page.